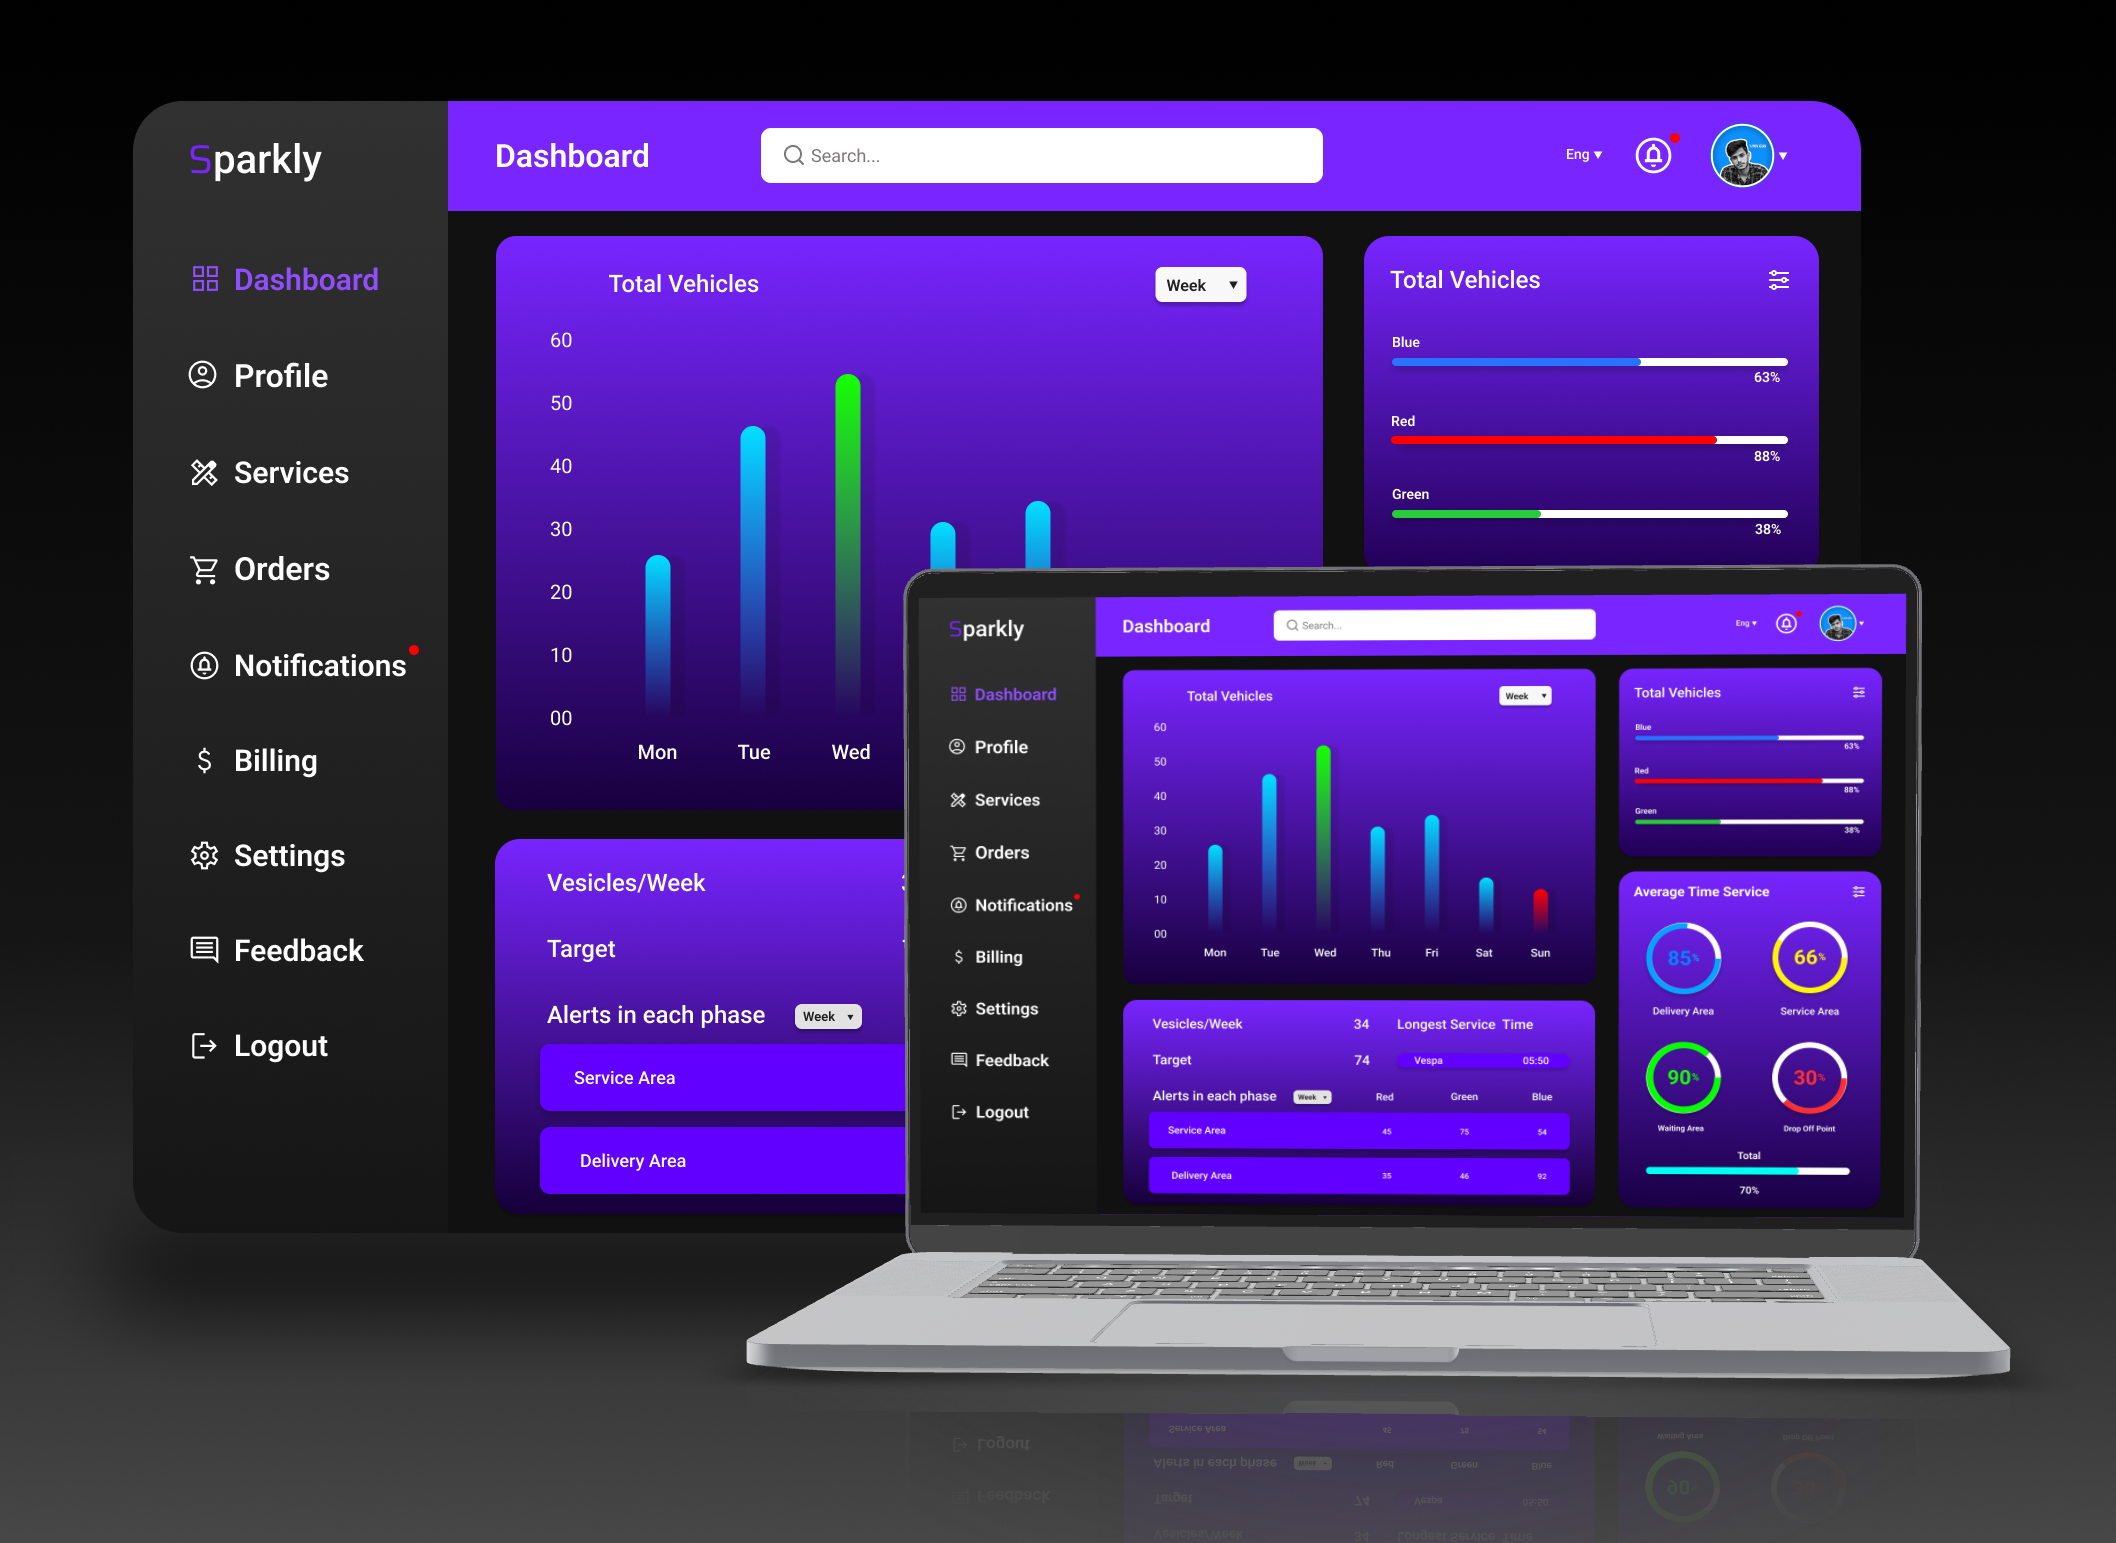
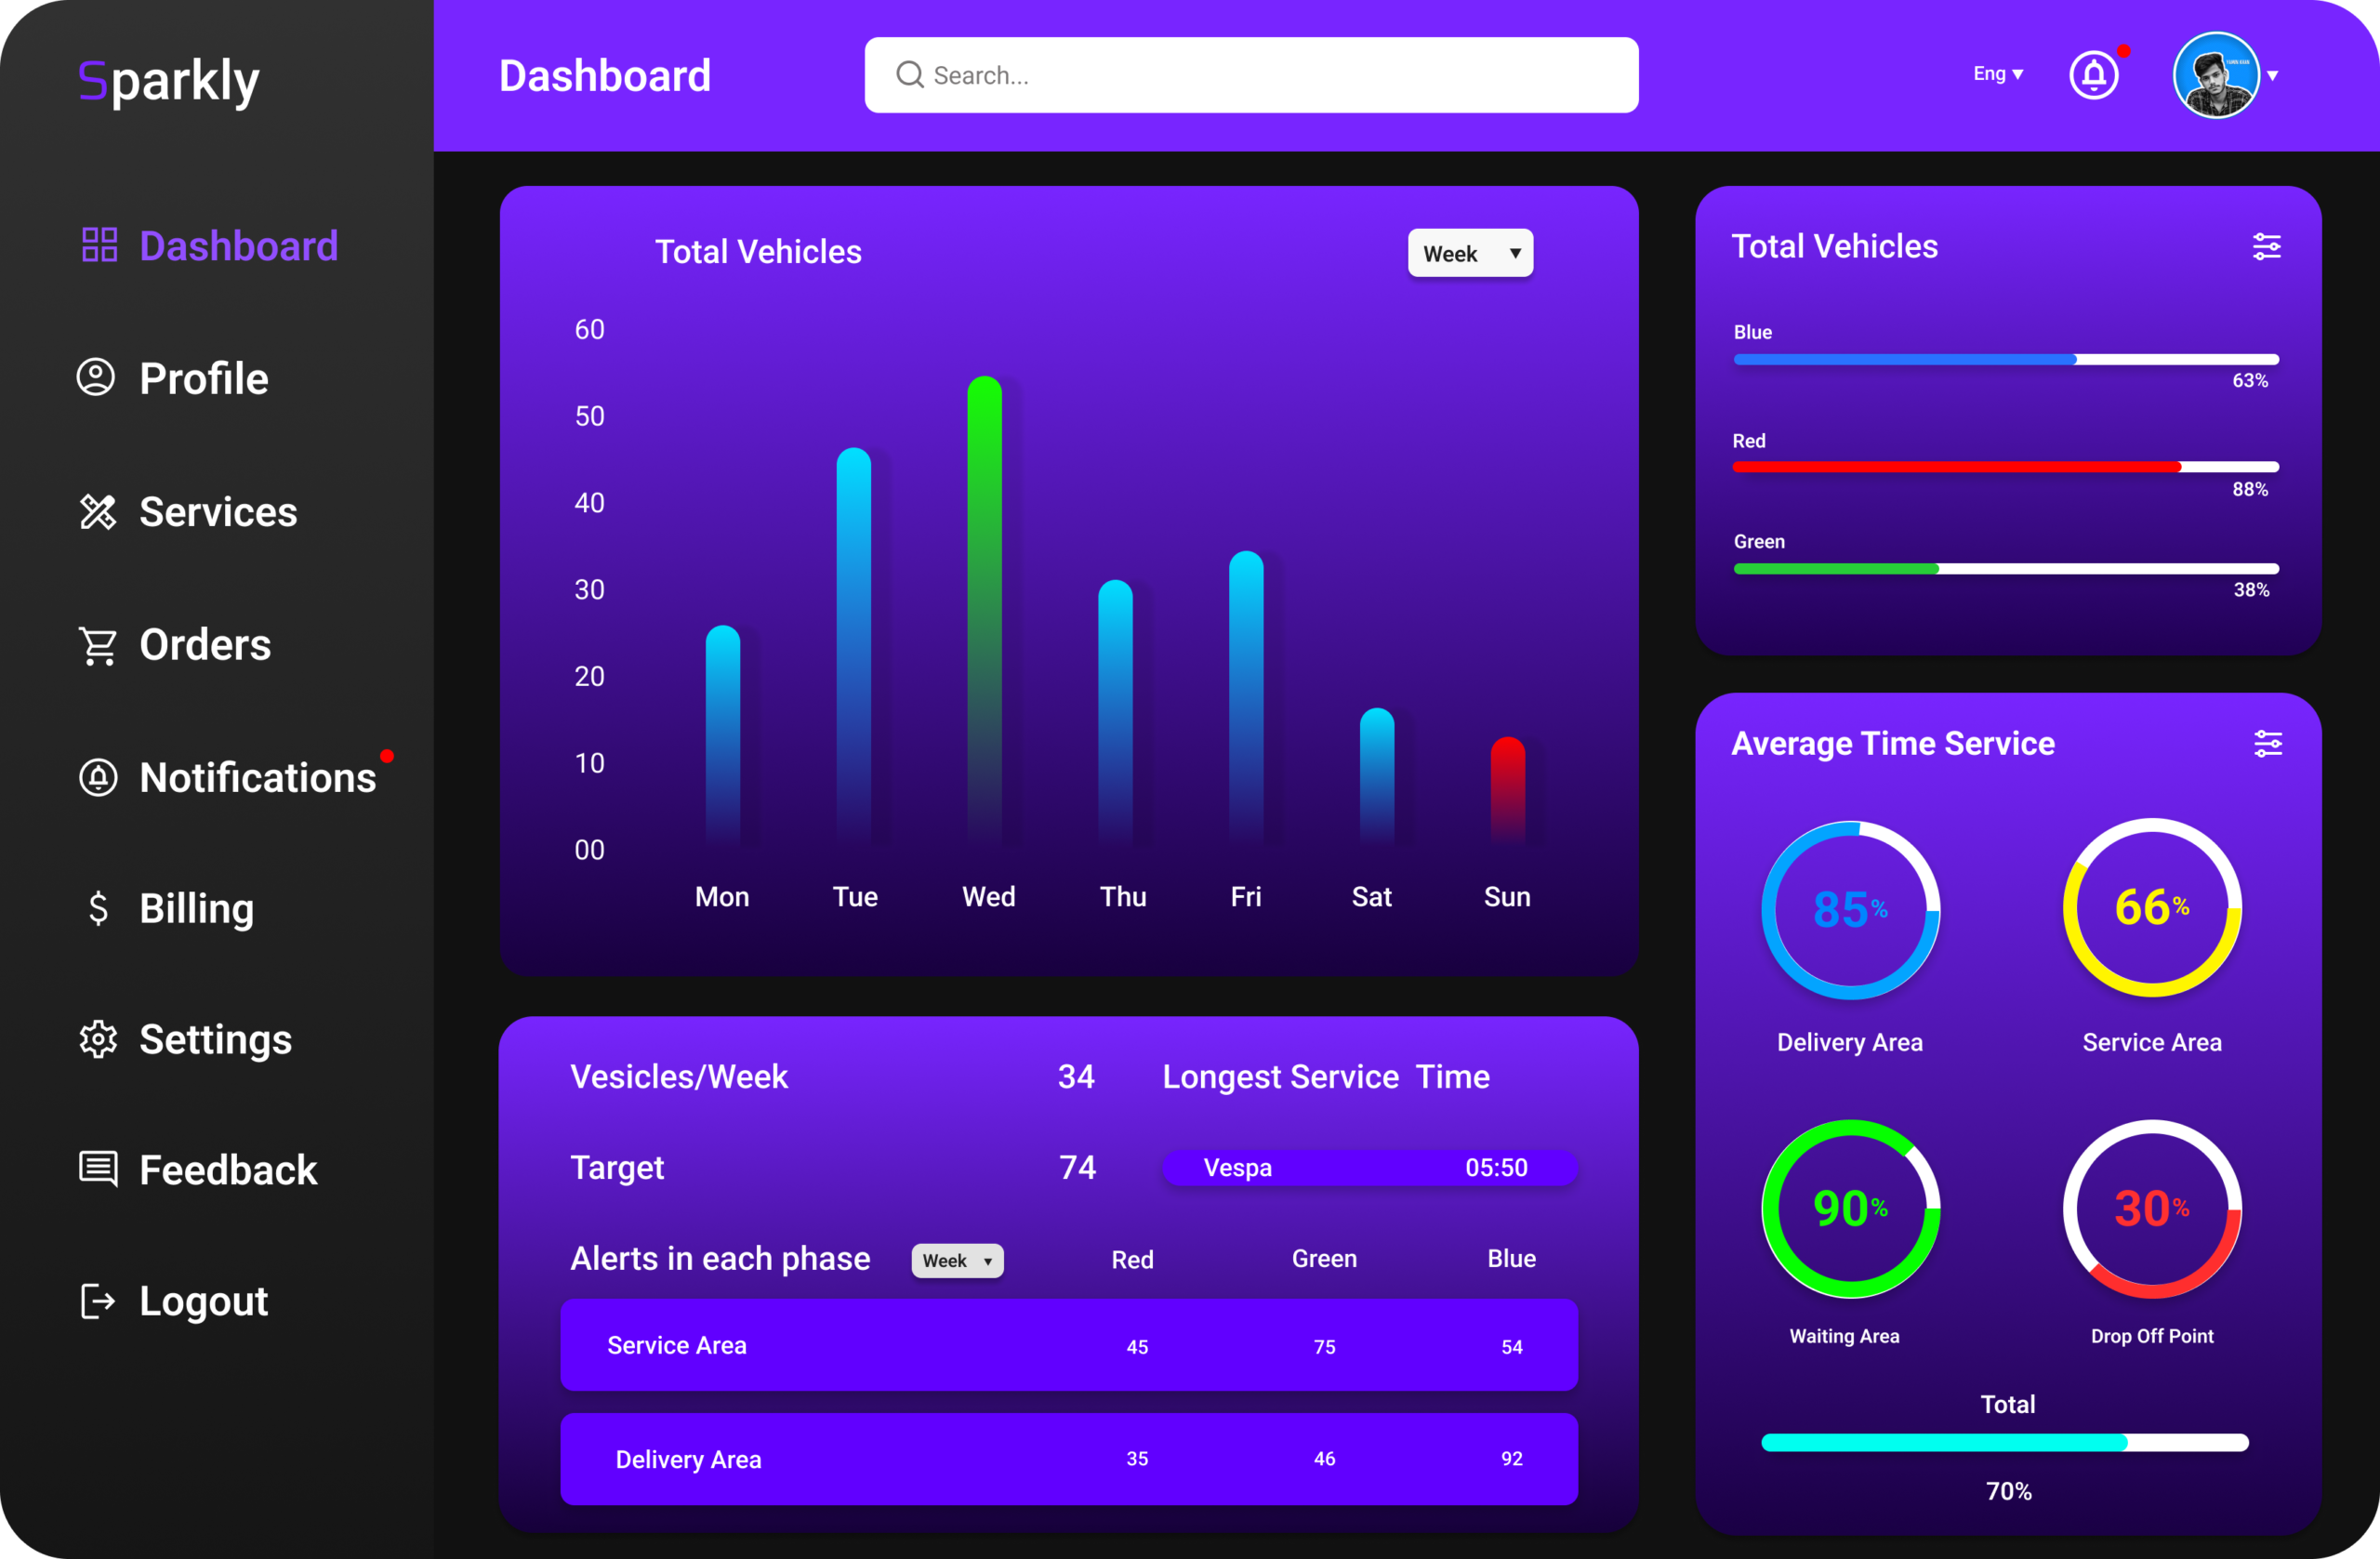
Overview:
The goal of this project was to design an intuitive and user-friendly dashboard for a SaaS web application. The dashboard provided an overview of the key metrics and KPIs that were relevant to the end-users of the application. It will be used by a wide range of stakeholders, including business owners, managers, and employees.
Objectives:
▶ To provide a clear and concise overview of the key performance indicators of the SaaS application.
▶ To allow users to quickly and easily access the information and data they need to make informed decisions.
▶ To present data in an aesthetically pleasing and visually appealing way.
▶ To ensure the dashboard is responsive and optimized for both desktop and mobile devices.
Key Features:
▶ Overview of key performance metrics: The dashboard will display key performance metrics such as daily active users, monthly recurring revenue, and churn rate.
▶ Customizable Widgets: Users will be able to add, remove, and rearrange widgets on the dashboard to best suit their needs.
▶ Data Visualization: The dashboard will make use of various data visualization techniques, such as charts, graphs, and tables, to help users understand the data.
▶ Interactive Filters: The dashboard will provide users with the ability to filter data by date range, region, and other relevant factors.
▶ Responsive Design: The dashboard will be optimized for desktop and mobile devices, ensuring it is easily accessible to all users.
▶ Data Integration: The dashboard will be integrated with the underlying data sources, allowing for real-time updates and ensuring that the data displayed is always up-to-date.
▶ User Management: The dashboard will provide the ability to add, edit, and remove users, as well as assign different levels of access and permissions.
Deliverables:
▶ A fully functional and responsive dashboard design that meets the objectives and key features outlined above.
▶ A detailed user manual and training materials to help users understand how to use the dashboard effectively.
▶ A comprehensive testing plan to ensure the dashboard is functioning as expected and meets the quality standards.
▶ A post-implementation review to gather feedback and identify any areas for improvement.
Timeline: The estimated timeline for this project was 5 days, with regular check-ins and updates provided throughout the development process.
Budget: The budget for this project was 80$